收缩调整夏普比率:一种更优的选择共同基金的方法
导读
作为西学东渐--海外文献推荐系列报告第一百五十篇,本文推荐了Moshe Levy和Richard Roll于2022年发表的论文《The Shrinkage Adjusted Sharpe Ratio: An Improved Method for Mutual Fund Selection》。
历史夏普比是投资者选择基金最常用的指标之一,投资者希望历史表现优异的基金未来能够延续其优势表现,但简单的历史夏普比率在预测基金未来表现上的效果不够理想,因此本文尝试对夏普比进行改良。
本文改良的原理如下:历史基金收益相对未来基金收益是有噪声的估计项,但基金费用对未来基金收益却是已知的(无噪声的)扣减项,因此在估计未来基金收益时应当适当放大基金费用的权重。为了实现这一点,本文引入Bayes-James-Stein估计量中的收缩因子构造了收缩调整的夏普比率(Shrinkage Adjusted Sharpe ratio 简称(SAS)),通过收缩因子在SAS指标中适当增加费用的权重,减少历史收益的权重。
实证结果表明,SAS指标对未来基金业绩的预测能力显著优于简单夏普比率,并且这个指标对于不同的基金类型、时间区间以及估计窗口的预测结果均比较稳健。
风险提示:文献中的结果均由相应作者通过历史数据统计、建模和测算完成,在政策、市场环境发生变化时模型存在失效的风险。
1、引言
考虑两个基金:基金A的年平均总收益率为11%,管理费为1%。基金B的年平均总收益率为12%,收取2%的费用。简单起见,假设这两只基金波动率相同,那么投资者应该选择哪个基金呢?乍一看,这两只基金似乎是无差别的,因为它们的净收益均为10%。但是,平均总收益率是有噪声的估计,而费用是已知的,因此费用的权重应该大于收益的权重。在极端的情况下,即当收益率数据不包括任何关于未来的有用信息时,可以忽略收益率,而只根据费用对基金进行排名。在一般情况下,历史收益率是关于未来收益有噪声的信号,但问题是相较于费用,我们应该给这个信号多少权重呢?这就是本文讨论的主要问题。
2、收缩调整夏普比率(SAS)

3、数据和结果
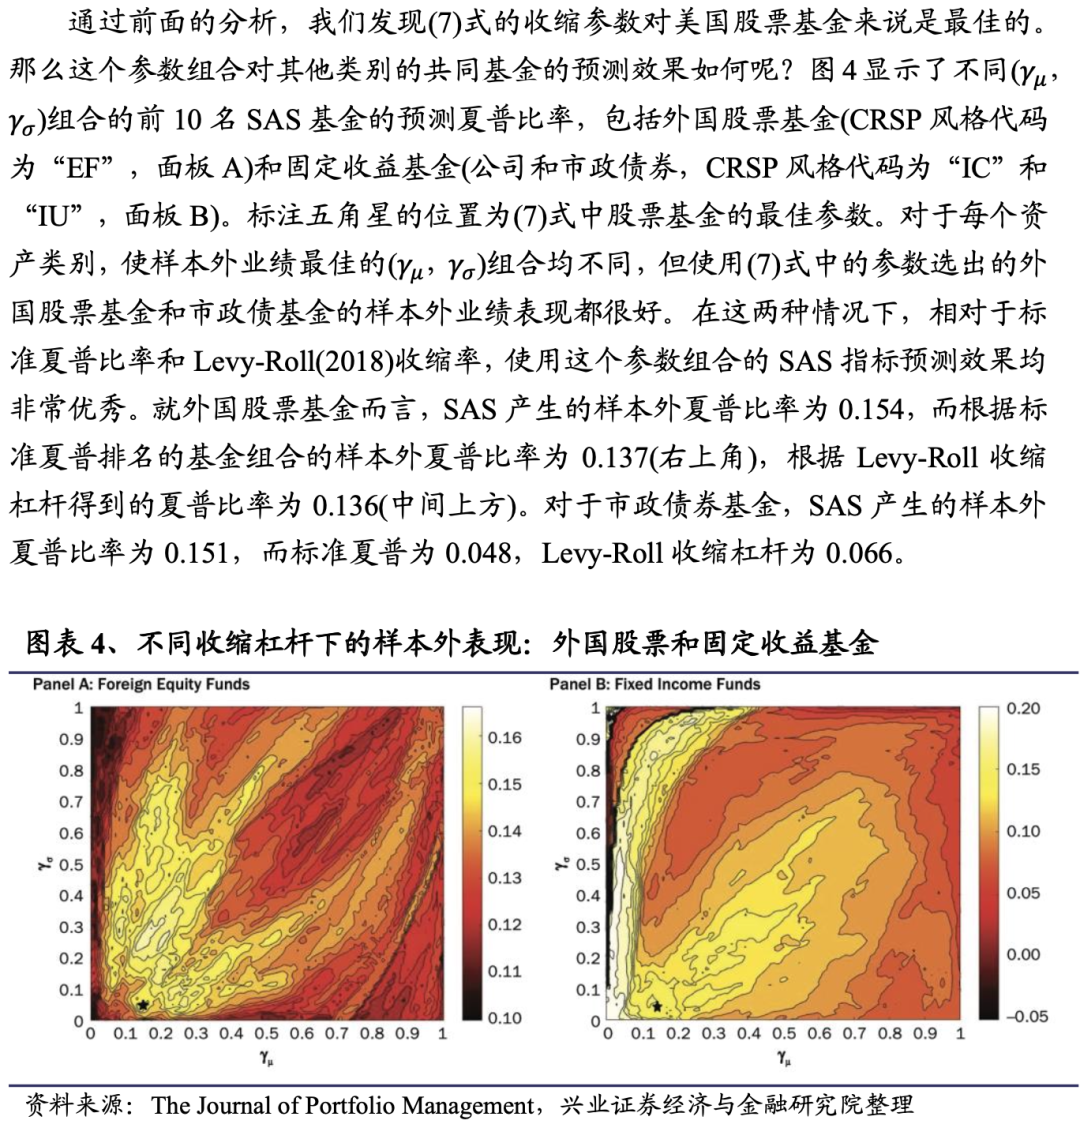
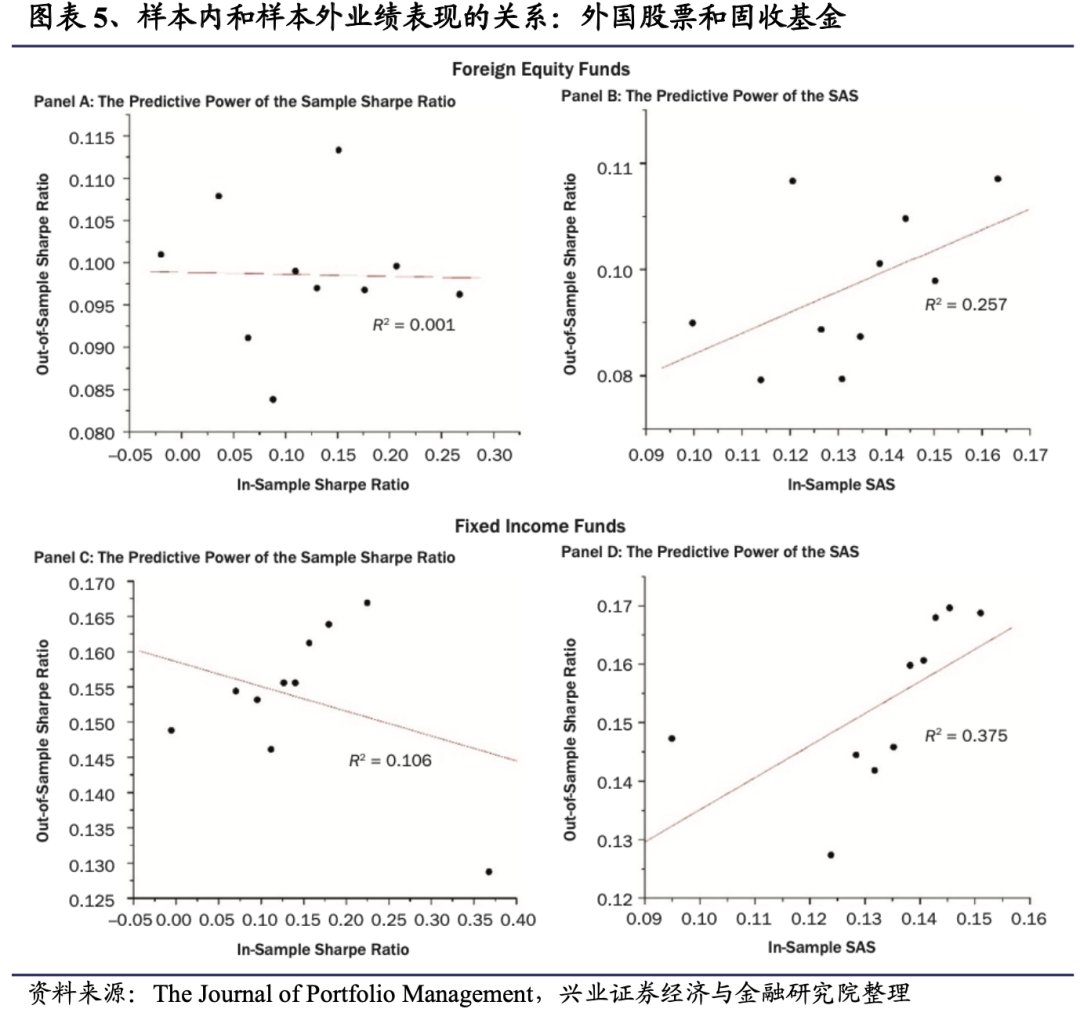
我们主要研究美国的股票基金(CRSP中风格代码以“ED”开头的所有基金)。在下一节中,我们还单独研究了外国股票基金(CRSP风格代码以“EF”开头的所有基金),以及公司和市政债券基金(CRSP风格代码以“IC”和“IU”开头的所有基金)。
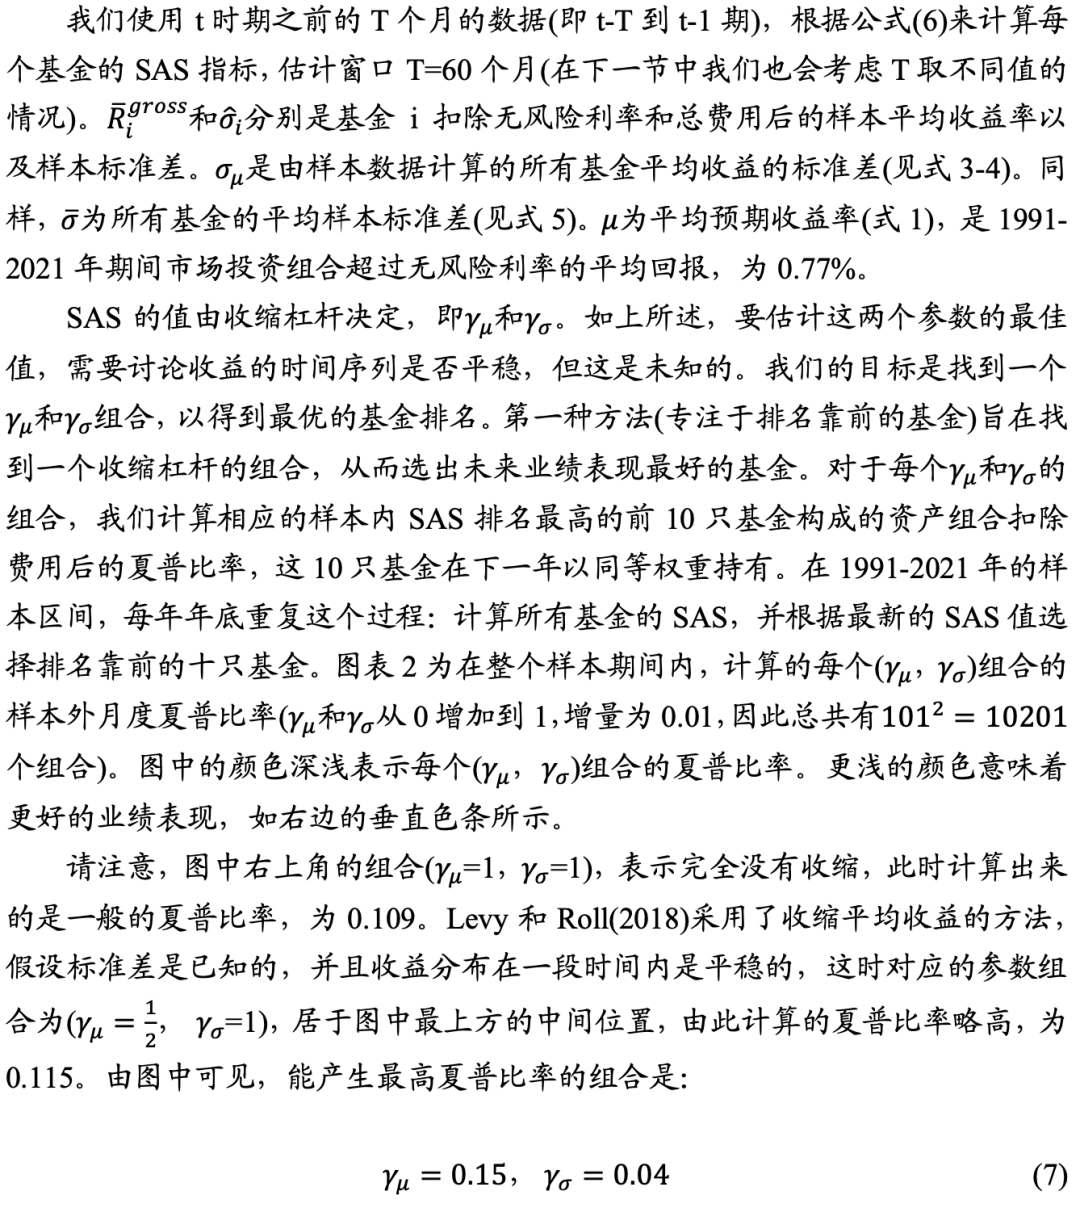
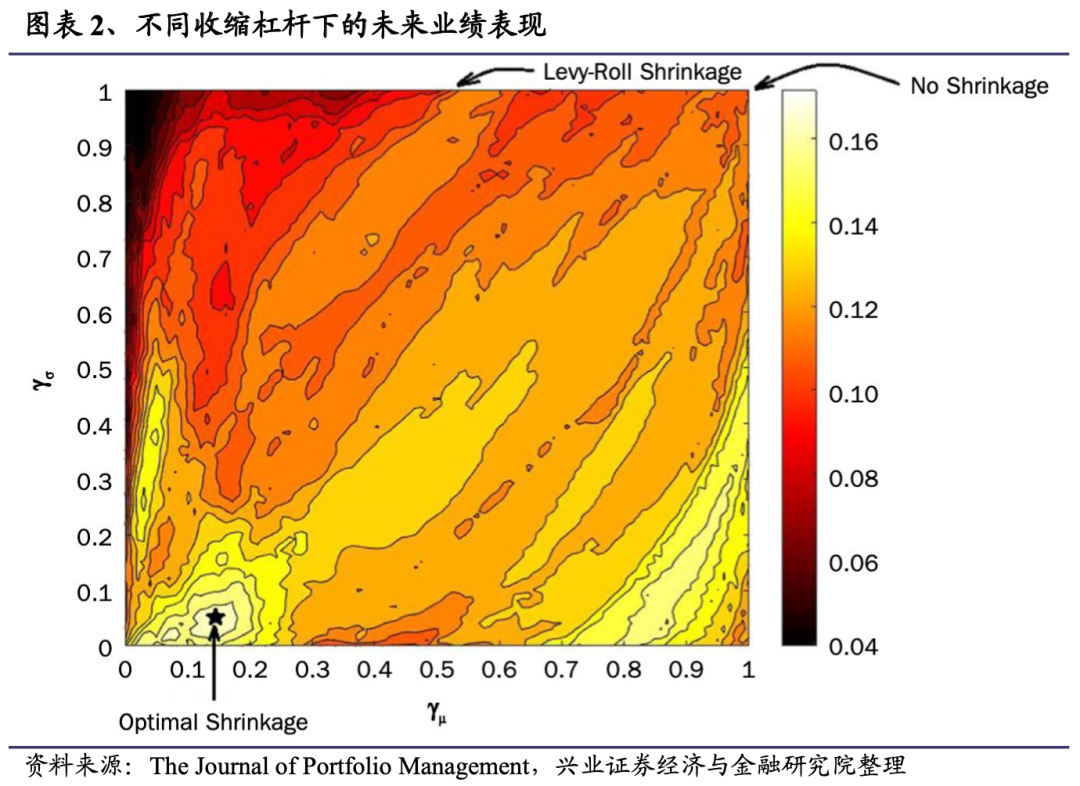
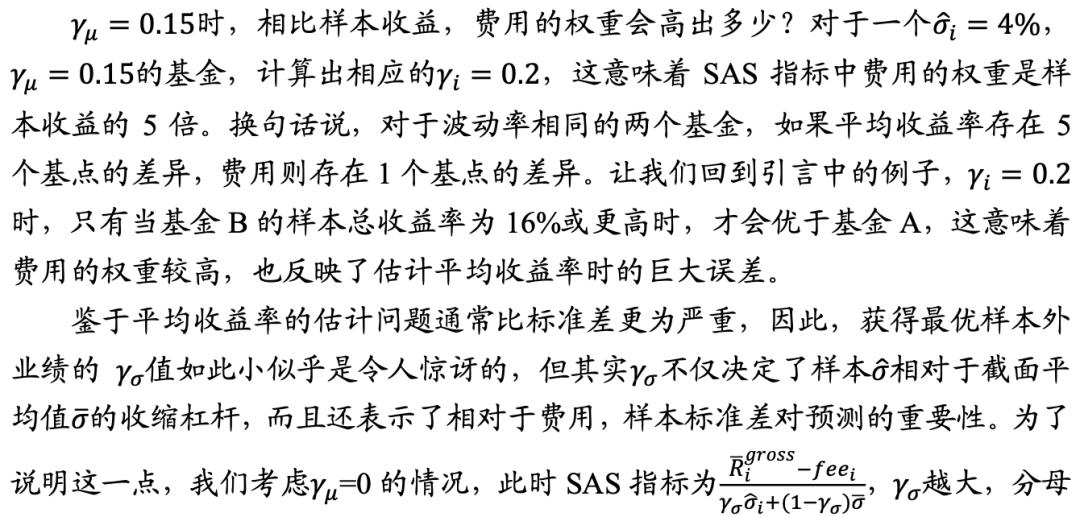

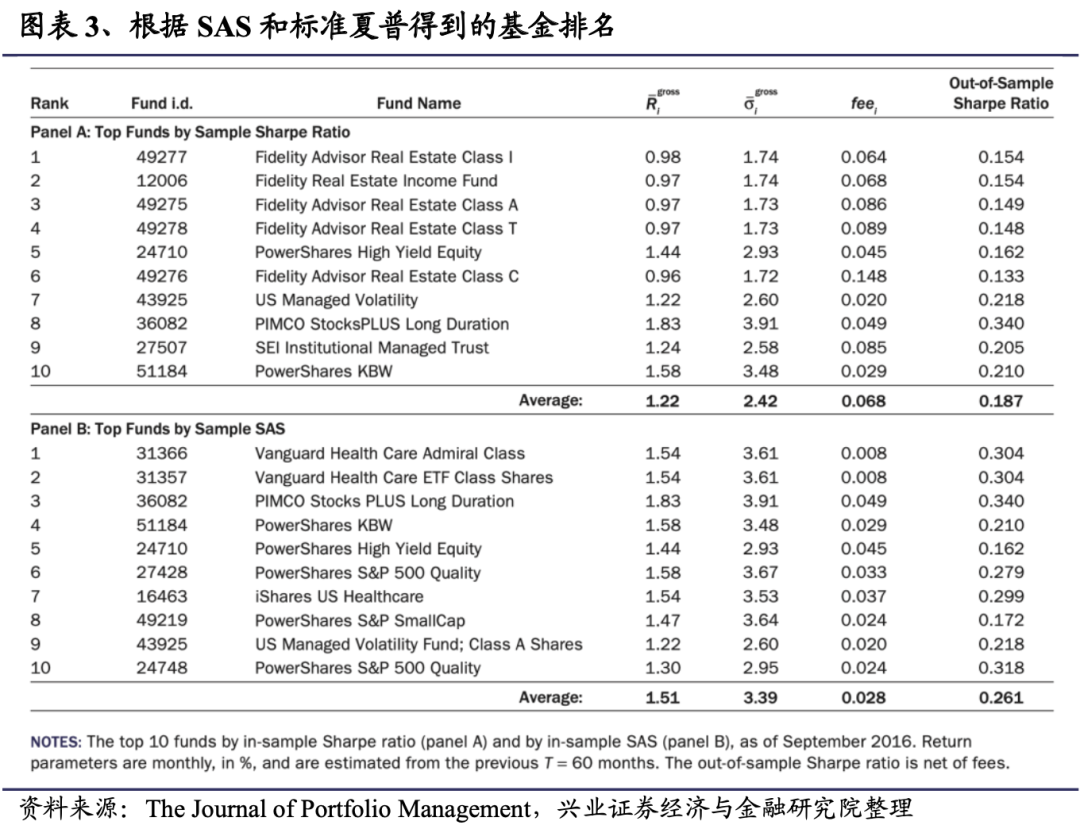
4、关于稳健性的讨论
4.1
资产类别

4.2
不同的样本区间
4.3
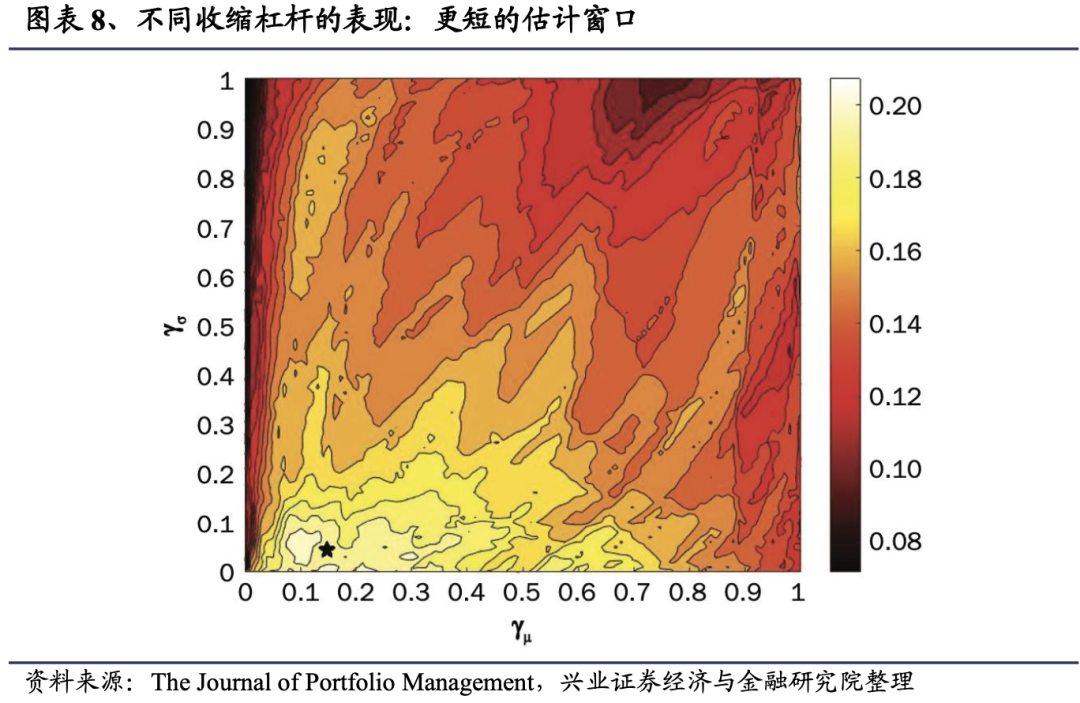
更短的估计窗口
5、总结
6、附录
6.1
附录A:
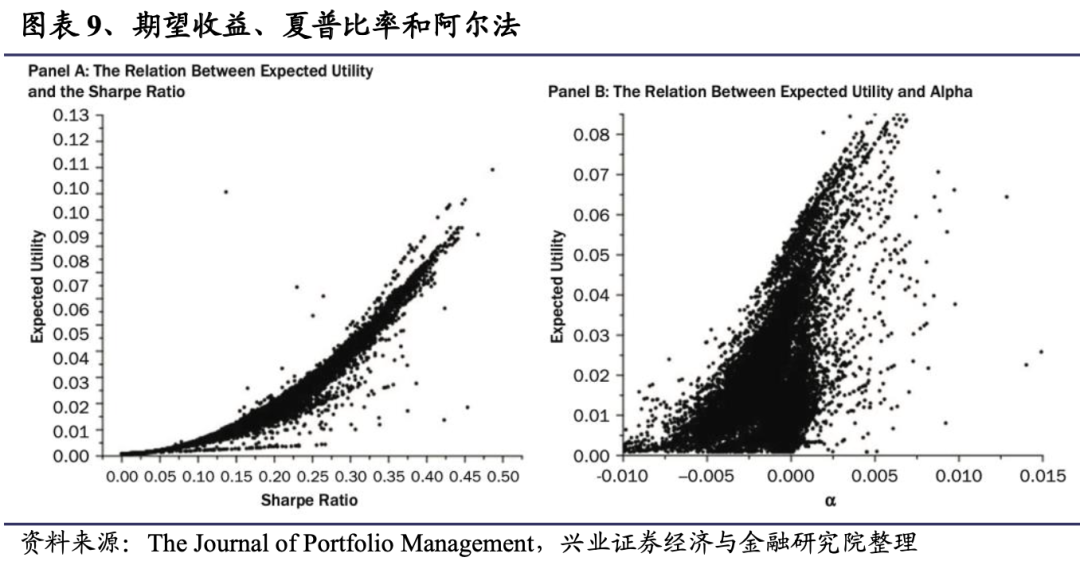
共同基金的选择:夏普v.s.阿尔法
6.2
附录B:百分位业绩表现
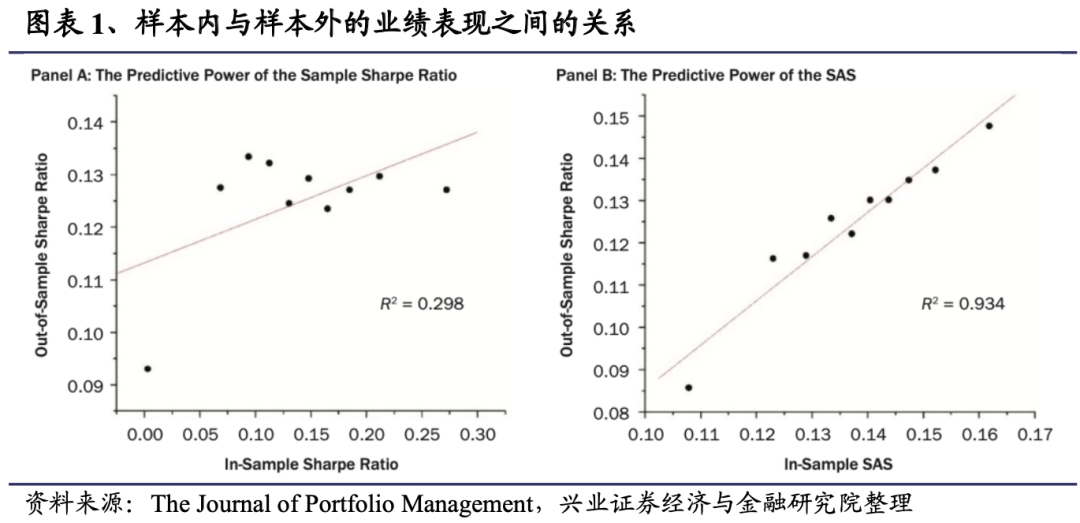
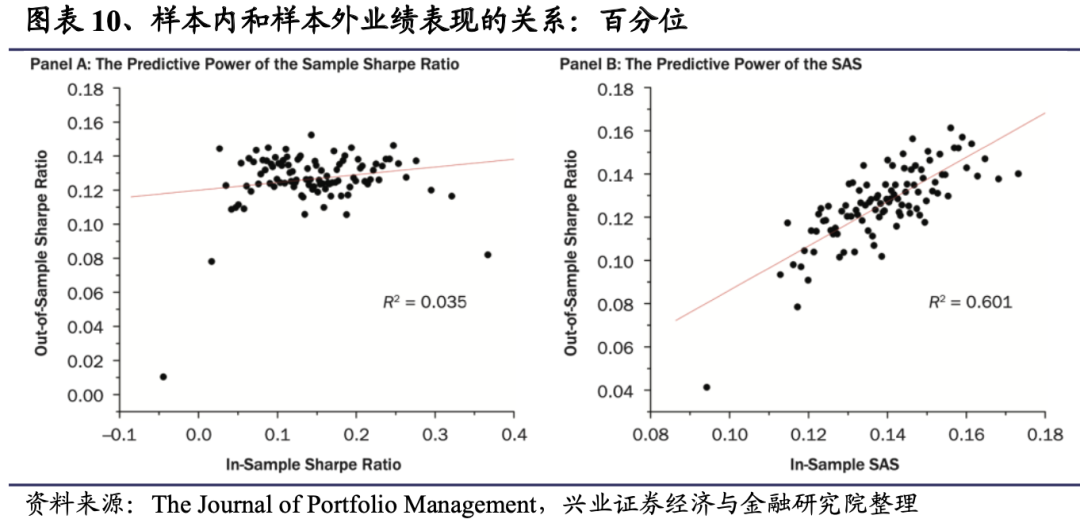
下图为样本内业绩与样本外夏普比率之间的关系。采用所有美国股票基金1991年12月至2021年9月(数据和实证方法的详细描述见第3节)的数据。根据基金的样本内业绩进行排名,并将其分为100个百分位数。对于每个百分位数,计算样本内平均业绩和样本外平均夏普比率(扣除费用)。A组以标准夏普比率(扣除费用)作为样本内业绩衡量标准。B组以SAS作为业绩衡量标准。
参考文献
[1] Barras, L., O. Scaillet, and R. Wermers. 2010. “False Discoveries in Mutual Fund Performance: Measuring Luck in Estimated Alphas.” The Journal of Finance 65 (1): 179–216.
[2] Bayes, T., and P. Richard. 1763. “An Essay Towards Solving A Problem in the Doctrine of Chance.” Philosophical Transactions of the Royal Society of London 53: 370–418.
[3] Berk, J. B., and J. H. Van Binsbergen. 2015. “Measuring Skill in the Mutual Fund Industry.” Journal of Financial Economics 118 (1): 1–20.
[4] Blake, D., T. Caulfield C. Ioannidis, and I. Tonks. 2017. “New Evidence on Mutual Fund Performance: A Comparison of Alternative Bootstrap Methods.” Journal of Financial and Quantitative Analysis Vol (Issue))?: 1–21.
[5] Bogan, V. 2008. “Stock Market Participation and the Internet.” Journal of Financial and Quantitative Analysis 43 (1): 191–211.
[6] Bollen, N.P., and J. A. Busse. 2001. “On the Timing Ability of Mutual Fund Managers.” The Journal of Finance 56 (3): 1075–1094.
[7] Busse, J. A., T. Chordia, L. Jiang, and Y. Tang. 2021. “Transaction Costs, Portfolio Characteristics, and Mutual Fund Performance.” Management Science 67 (2): 1227–1248.
[8] Carhart, M. M. 1997. “On Persistence in Mutual Fund Performance.” The Journal of Finance 52 (1): 57–82.
[9] Chevalier, J., and G. Ellison. 1999. “Are Some Mutual Fund Managers Better Than Others? Cross-Sectional Patterns in Behavior and Performance.” The Journal of Finance 54 (3): 875–899.
[10] Cremers, K. M., J. A. Fulkerson, and T. B. Riley. 2018. “Benchmark Discrepancies and Mutual Fund Performance Evaluation.” Journal of Financial and Quantitative Analysis 1–52.
[11] Cremers, K. M., and A. Petajisto. 2009. “How Active is Your Fund Manager? A New Measure that Predicts Performance.” The Review of Financial Studies 22 (9): 3329–3365.
[12] Daniel, K., M. Grinblatt, S. Titman, and R. Wermers. 1997. “Measuring Mutual Fund Performance with Characteristic-Based Benchmarks.” The Journal of Finance 52 (3): 1035–1058.
[13] DeMiguel, V., A. Martin-Utrera, and F. J. Nogales. 2013. “Size Matters: Optimal Calibration of Shrinkage Estimators for Portfolio Selection.” Journal of Banking and Finance 37 (8): 3018–3034. Fama, E. F. The Journal of Finance 65 (5): 1915–1947.
[14] Fama, E. F., and K. R. French. 2015. “A Five-Factor Asset Pricing Model.” Journal of Financial Economics 116 (1): 1–22.
[15] Garlappi, L., R. Uppal, and T. Wang. 2007. “Portfolio Selection with Parameter and Model Uncer- tainty: A Multi-Prior Approach.” The Review of Financial Studies 20 (1): 41–81.
[16] Gârleanu, N., and L. H. Pedersen. 2021. “Active and Passive Investing: Understanding Samuelson’s Dictum.” Review of Asset Pricing Studies, forthcoming.
[17] Genton, M.G., and E. Ronchetti. Robust Prediction of Beta. In Computational Methods in Financial Engineering Springer, Berlin, Heidelberg. 2008.
[18] Guercio, D. D., and J. Reuter. 2014. “Mutual Fund Performance and the Incentive to Generate Alpha.” The Journal of Finance 69 (4): 1673–1704.
[19] Hadar, J., and W. R. Russell. 1969. “Rules for Ordering Uncertain Prospects.” The American Economic Review 59 (1): 25–34.
[20] Hanoch, G., and H. Levy. 1969. “The Efficiency Analysis of Choices Involving Risk.” The Review of Economic Studies 36 (3): 335–346.
[21] Harvey, C. R., and Y. Liu. 2018. “Detecting Repeatable Performance.” The Review of Financial Studies 31 (7): 2499–2552.
[22] Harvey, C. R., and Y. Liu. 2020. “Luck versus Skill in the Cross-Section of Mutual Fund Returns: Reexamining the Evidence.” Available at SSRN 3623537.
[23] James, W., and C. Stein. Estimation with Quadratic Loss. In Proceedings of the Fourth Berkeley Symposium on Mathematical Statistics and Probability, Volume 1: Contributions to the Theory of Statistics. 1961.
[24] Jiang, H., and M. Verardo. 2018. “Does Herding Behavior Reveal Skill? An Analysis of Mutual Fund Performance.” The Journal of Finance 73 (5): 2229–2269.
[25] Jones, C. S., and J. Shanken. 2005. “Mutual Fund Performance with Learning across Funds.” Journal of Financial Economics 78 (3): 507–552.
[26] Jorion, P. 1985. “International Portfolio Diversification with Estimation Risk.” Journal of Business 259–278.
[27] Jorion, P. 1986. “Bayes-Stein Estimation for Portfolio Analysis.” Journal of Financial and Quantitative Analysis 21 (3): 279–292.
[28] Jorion, P. 1991. “Bayesian and CAPM Estimators of the Means: Implications for Portfolio Selection.” Journal of Banking and Finance 15 (3): 717–727.
[29] Kinnel, R. 2010. “How Expense Ratios and Star Ratings Predict Success.” https://www.morning-star.com/articles/347327/article.
[30] Kircher, F., and D. Rösch. 2021. “A Shrinkage Approach for Sharpe Ratio Optimal Portfolios with Estimation Risks.” Journal of Banking and Finance 133: 106281.
[31] Kosowski, R., A. Timmermann R. Wermers, and H. White. 2006. “Can Mutual Fund “Stars” Really Pick Stocks? New Evidence from A Bootstrap Analysis.” The Journal of Finance 61 (6): 2551–2595.
[32] Kroll, Y., H. Levy, and H. M. Markowitz. 1984. “Mean-Variance versus Direct Utility Maximization.” The Journal of Finance 39 (1): 47–61.
[33] Ledoit, O., and M. Wolf. 2004. “Honey, I Shrunk the Sample Covariance Matrix.” The Journal of Portfolio Management 30 (4): 110–119.
[34] Ledoit, O., and M. Wolf. 2017. “Nonlinear Shrinkage of the Covariance Matrix for Portfolio Selection: Markowitz meets Goldilocks.” The Review of Financial Studies 30 (12): 4349–4388.
[35] Ledoit, O., and M. Wolf. 2020. “The Power of (Non-) Linear Shrinking: A Review and Guide to Covariance Matrix Estimation.” Journal of Financial Econometrics Vol (Issue): pages?
[36] Lee, P. M. Bayesian Statistics. London: Oxford University Press. 2012.
[37] Levi, Y., and I. Welch. 2017. “Best Practice for Cost-of-Capital Estimates.” Journal of Financial and Quantitative Analysis 52 (2): 427–463.
[38] Levy, H., E. G. De Giorgi, and T. Hens. 2012. “Two Paradigms and Nobel Prizes in Economics: A Contradiction or Coexistence?” European Financial Management 18 (2): 163–182.
[39] Levy, H., and M. Levy. 2004. “Prospect Theory and Mean-Variance Analysis.” Review of Financial Studies 17 (4): 1015–1041.
[40] Levy, H., and H. M. Markowitz. 1979. “Approximating Expected Utility by A Function of Mean and Variance.” The American Economic Review 69 (3): 308–317.
[41] Levy, M. 2023. “The Deadweight Loss of Active Management.” The Journal of Investing, forthcoming. Levy, M., and R. Roll. 2016. “Seeking alpha? It’s A Bad Guideline for Portfolio Optimization.” The Journal of Portfolio Management 42 (5): 107–112.
[42] ——. 2018. “Generalized Performance Measures: Optimal Overweighing of Fees Relative to Sample Returns.” The Journal of Portfolio Management 44 (3): 66–75.
[43] Rachev, S., T. Jašic ́, S. Stoyanov, and F. J. Fabozzi. 2007. “Momentum Strategies Based on Reward–Risk Stock Selection Criteria.” Journal of Banking & Finance 31 (8): 2325–2346.
[44] Sharpe, W. F. 1966. “Mutual Fund Performance.” The Journal of Business 39 (1): 119–138.
[45] ——. 1994. “The Sharpe Ratio.” The Journal of Portfolio Management 21 (1): 49–58.
[46] ——. 1998. “Morningstar’s Risk-Adjusted Ratings.” Financial Analysts Journal 54 (4): 21–33.
[47] Wang, Z. 2005. “A Shrinkage Approach to Model Uncertainty and Asset Allocation.” Review of Financial Studies Vol. (Issue): 673–-75.
[48] Zheng, L. 1999. “Is Money Smart? A Study of Mutual Fund Investors’ Fund Selection Ability.” The Journal of Finance 54 (3): 901–933.
风险提示:文献中的结果均由相应作者通过历史数据统计、建模和测算完成,在政策、市场环境发生变化时模型存在失效的风险。

注:文中报告节选自兴业证券经济与金融研究院已公开发布研究报告,具体报告内容及相关风险提示等详见完整版报告。
证券研究报告:《西学东渐--海外文献推荐系列之一百五十》
对外发布时间:2023年1月8日
报告发布机构:兴业证券股份有限公司(已获中国证监会许可的证券投资咨询业务资格)
--------------------------------------
分析师:郑兆磊
SAC执业证书编号:S0190520080006
沈鸿
SAC执业证书编号:S0190521120001
--------------------------------------
更多量化最新资讯和研究成果,欢迎关注我们的微信公众平台(微信号:XYQuantResearch)!
本篇文章来源于微信公众号: XYQuantResearch
